analytics dashboard
Smart data, smarter decisions.
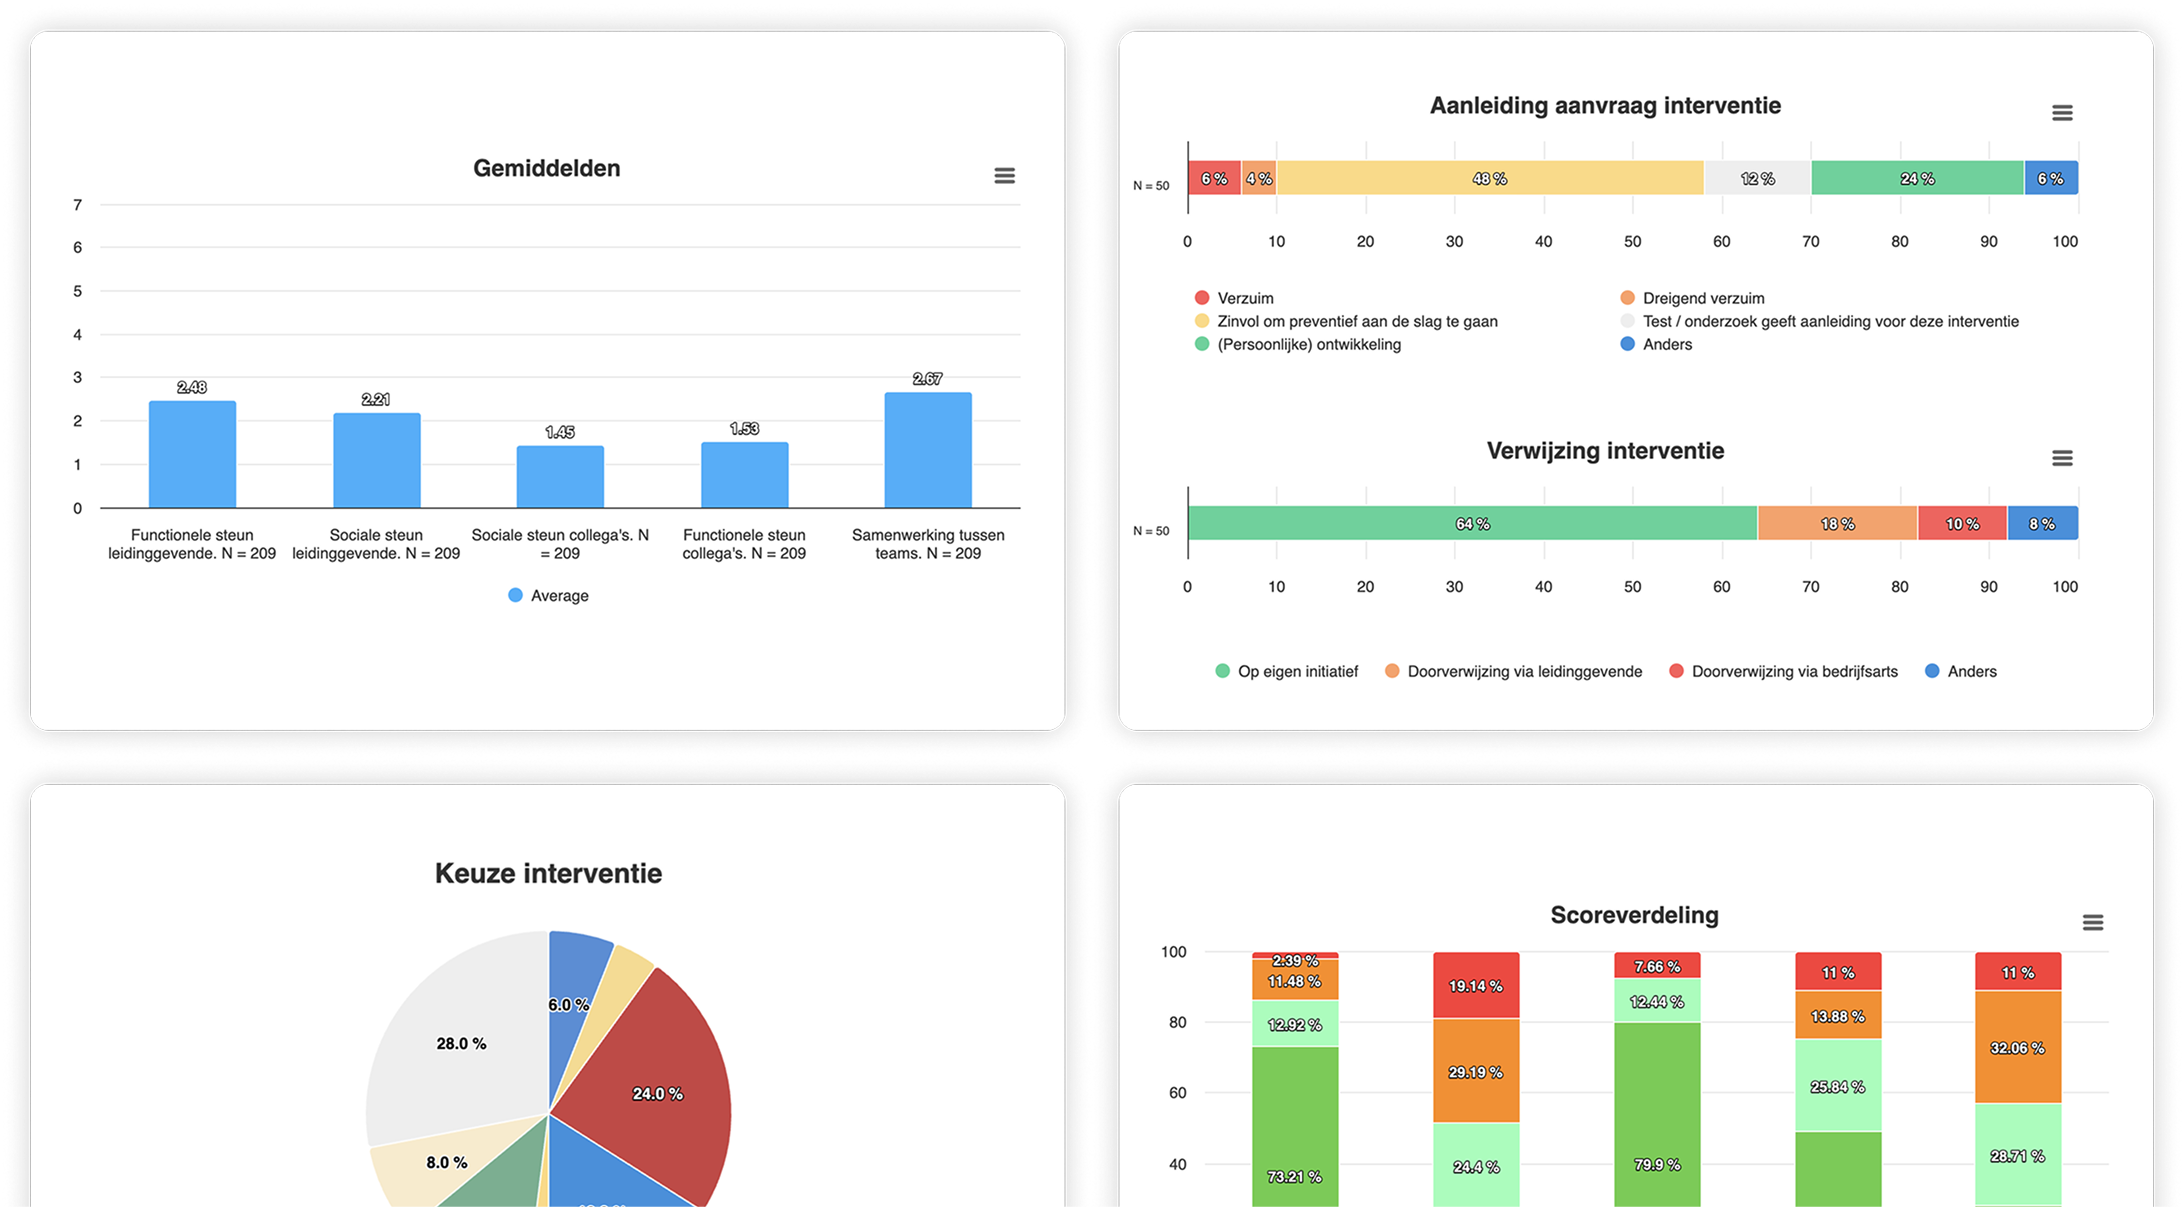
Get real-time insights, discover trends and make data-driven decisions. Filter, visualize and analyze results easily for better direction and impact.

personalized reports
Just the way you want it.
Easily create your own personalized reports without technical knowledge. Use different widgets and choose from different chart types. Visualize data your way and get instant insights.
personalized offer
Cross-referencing and filtering.
Discover patterns by filtering data by tags or departments. Compare results, make connections and gain deeper insights for targeted actions.
api and webhooks
Seamless integration with other systems.
Easily receive and send test results via webhooks. This keeps all your systems always up to date with the most current information. Integrate seamlessly and automate processes for efficient and reliable data exchange.
Advanced Analysis.
Real-time
Instant data processing and display, so you always have up-to-date insight and can react quickly to changes.
Trend and Benchmark Analysis
Track trends over time and compare performance to previous results or industry averages for targeted improvements.
Filter
Create segmentations based on departments, tags, tasks or projects.
Cross-Connections
Discover connections between different data by cleverly combining and analyzing data for deeper insights.
CSV and JSON exports
Easily export data to a CSV or JSON for further analysis. This allows you to quickly share, edit and process data in other tools.
GDPR proof
Fully compliant with GDPR/ AVG guidelines, ensuring personal data is processed and protected securely and according to the law.
All kinds of widgets.
Bar charts
A bar chart displays data as bars to compare categories and show trends at a glance.
Stacked bar charts
A stacked bar chart shows multiple data sets in one bar, so you can easily compare ratios and totals.
Radar charts
A radar chart visualizes multiple variables in a web form, ideal for comparing strengths and weaknesses.
Trend graphs
A trend graph visualizes developments over time, so you can easily analyze patterns, growth or declines.
Benchmarking
Compare performance to previous results, industry averages or other groups to identify areas of improvement and trends.