Data collection & questionnaires

Collect data and turn it into action.

Collect data through participants, coaches, executives or with other systems. Process this data with your own smart algorithms and turn it into measurements with tick-off points. Analyze insights and turn data into concrete actions for maximum impact and results.

calendar_month Schedule appointment for demo
Questionnaires

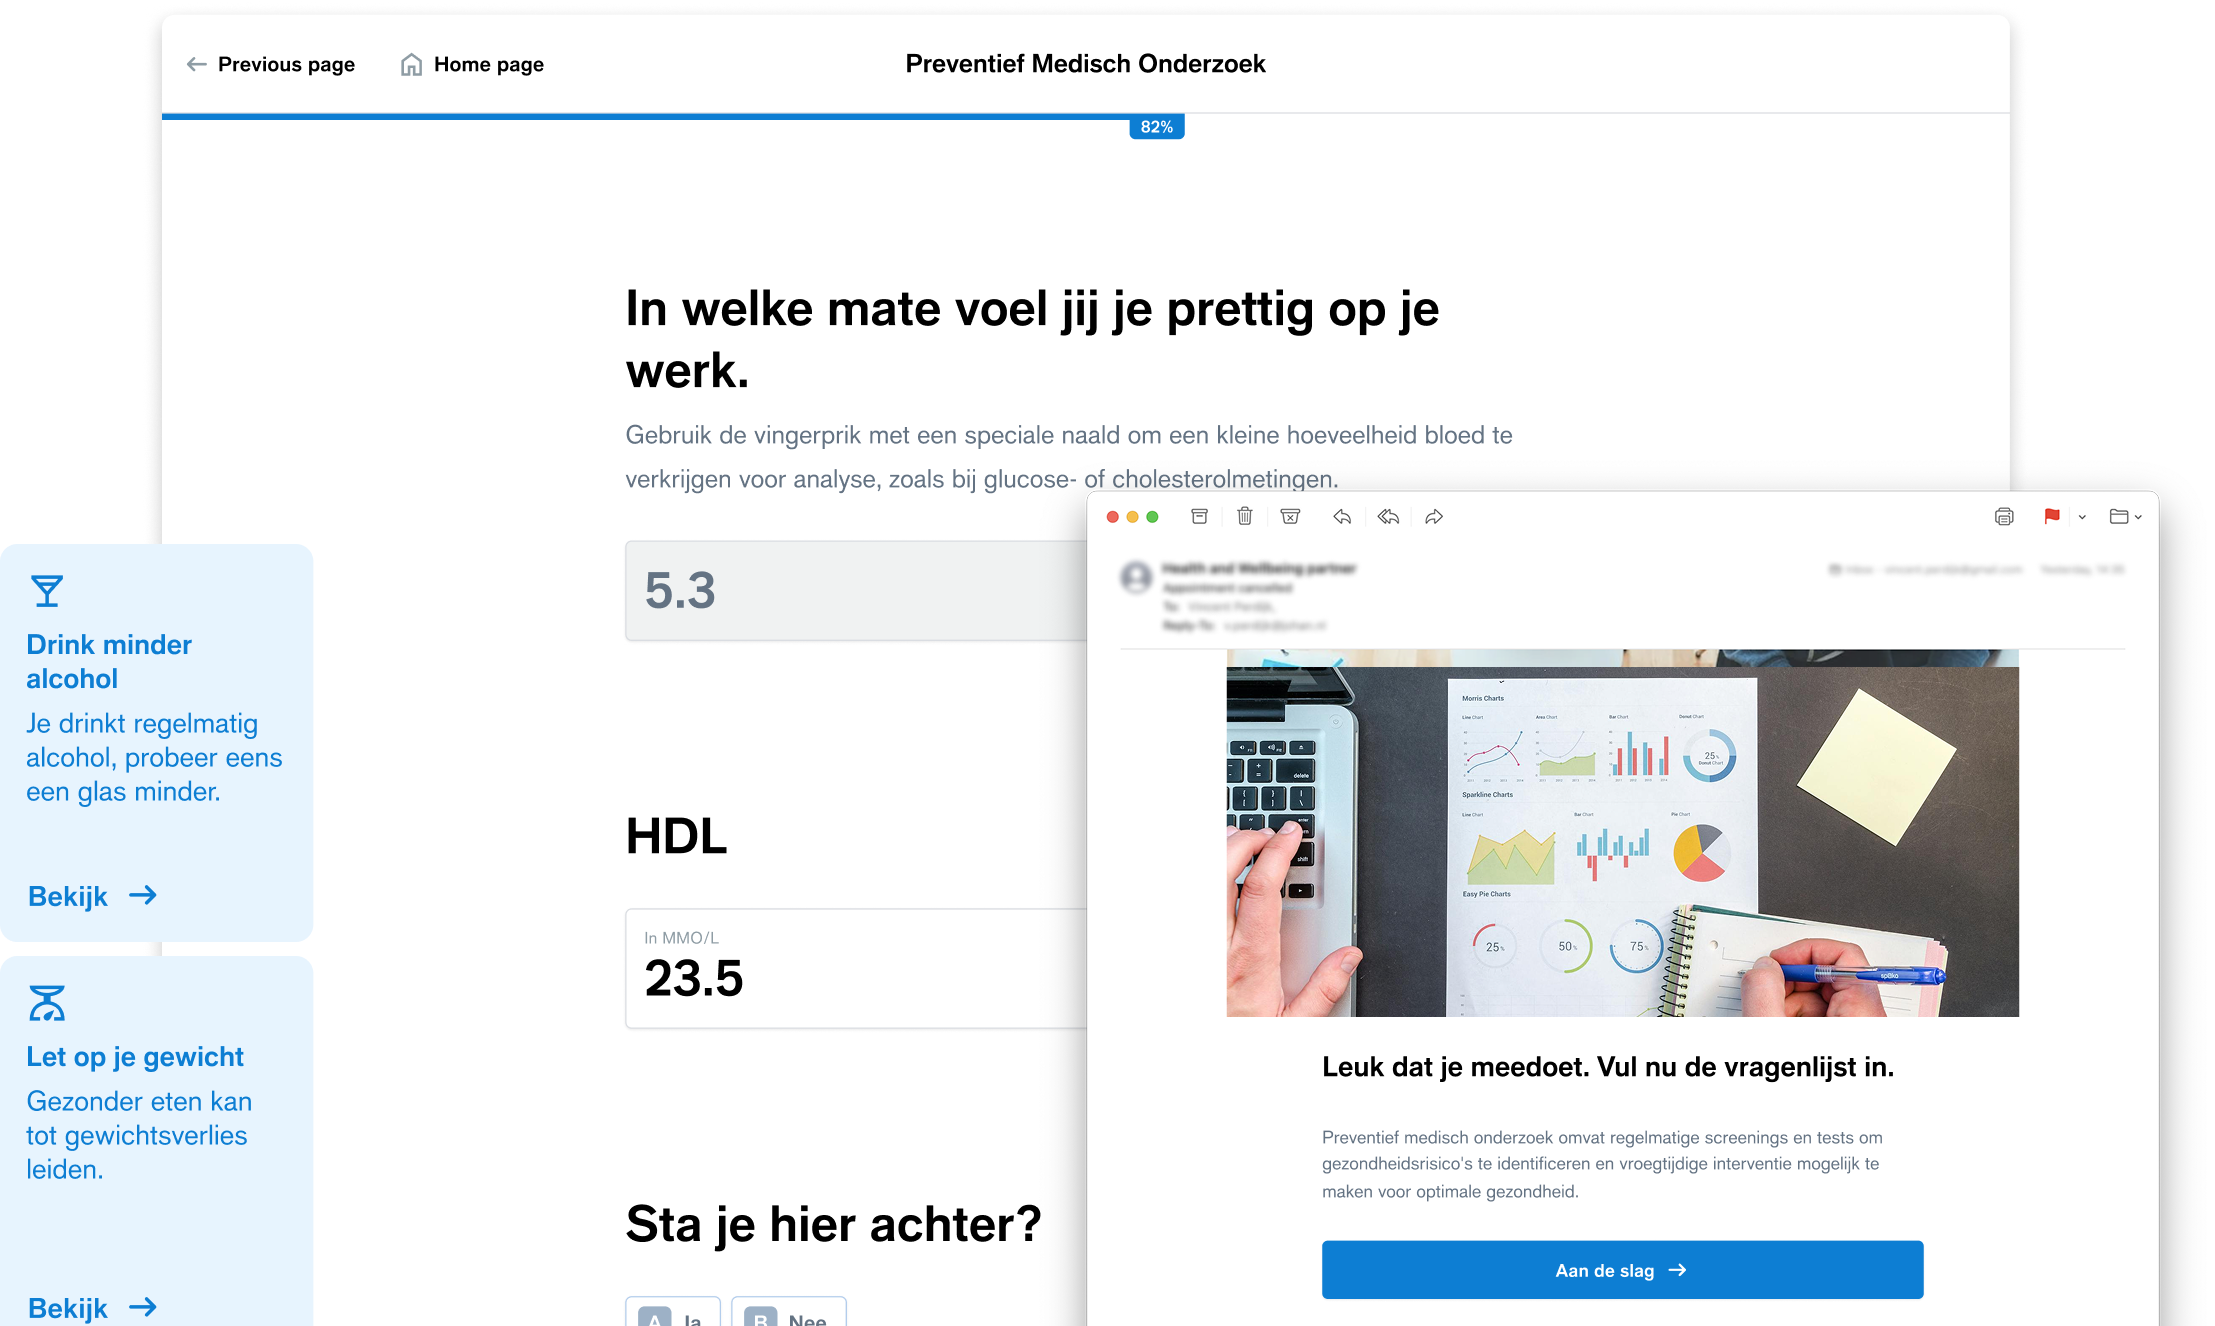
Collecting data your way.

Choose how you collect information about participants. Have participants fill out questionnaires directly, give coaches and professionals the ability to collect data about the deeknemer or use an integration via the API to shoot in data automatically. This way you always have a flexible and complete source of insights, just the way you want it.

measurements & algorithms

Data processing and enrichment.

Turn your results into measurements with cut-off points, use them to track trends and turn insights into follow-up actions. Develop your own algorithms to do more complex calculations, process data and gain better insights for the best decisions.

workflow builder

Dynamic questionnaires for any issue.

With smart conditions and triggers, the questionnaire cleverly adapts itself to participants' responses and suggestions. Ask questions about stress only when people are experiencing stress.

Flowbuilder Johan.nl software
Participant dashboard

The questionnaire is only the starting point.

Data collection is not an end in itself. Transform data into impact with a participant portal that adapts with smart triggers and conditions adapt to each user. Activate participants by continuously preparing relevant content that truly drives action.

tools

Reinforce your approach with tools from other experts.

Smart companies know where their strengths lie. Strengthen your practices with validated, scientific tools from recognized institutions. Use proven methods to get results faster and focus on what makes you unique.

Mini-DIX
The TNO Mini-DIX provides a first picture of the sustainable employability of employees.
COPSOQ
COPSOQ is an instrument to assess psychosocial risks at work.
Sustainable employability index
Measure an organization's sustainable employability on four key components with the TNO validated DIX questionnaire on Johan.nl.
My Positive Health
By using the Positive Health scan via the Johan.nl platform you give participants insight into how they are really doing in a safe way.
Energy Meter
The Energy Meter maps employees' mental energy, including energy sources and stressors.
Leading Sustainable Employability
This questionnaire helps strengthen the role of managers when it comes to sustainable employability.
Resilience Scan (VK+).
The VK+ is a questionnaire that provides a picture of mental resilience: the extent to which a person can cope with events and setbacks.
Psychosocial Workload (PSA).
Psychosocial workload (PSA) refers to all factors in the work situation that cause stress.
Work Ability Index (WAI).
The WAI is a validated scientific questionnaire that measures employees' work ability.
api and webhooks

Seamless integration with other systems.

Easily receive and send test results via webhooks. This keeps all your systems always up to date with the most current information. Integrate seamlessly and automate processes for efficient and reliable data exchange.

analytics dashboard

Analyze data,
real-time.

Establish KPI s and continuously measure participants' progress. Intervene where necessary and improve the process. This will help you reach your goal faster and increase the impact of your program.

At a glance.

All kinds of research

sentiment_satisfied
All types of questionnaires Collect feedback from employees, customers or participants to improve processes, products or services.
science
Physical measurements Make it possible to combine data with measurement tools such as sensors or physical evaluations.
event_repeat
Pulse Measurements Regularly track mood, engagement or performance with short, repeated questionnaires.
exposure_plus_1
Pre- and post-measurements (impact measurement). Measure the impact of interventions or changes by comparing data before and after the action.

All kinds of questions

quiz
Multiple choice or single choice Allow respondents to choose from a fixed list of options. Ideal for quick analyses and standardized answers.
list
Open questions Give respondents space to express their thoughts, opinions or ideas in their own words. Useful for qualitative insights.
text_fields
Scale questions Measure attitudes or opinions on a scale, such as a Likert scale (e.g., from completely disagree to completely agree").
scale
Upload files. Have respondents share documents or images as part of their response.

With complex logic

tactic
Conditional logic Ask follow-up questions depending on previous answers. This makes the questionnaire more personal and avoids irrelevant questions.
graph_1
Branching Run respondents through different routes based on their choices. Ideal for complex surveys with multiple audiences.
spellcheck
Automatic skipping Skip questions that do not apply, making the questionnaire shorter and more efficient.
skip_next
Answer Validation Instantly check whether answers meet specific criteria, such as numbers within a range or required fields.

Get with the times

calculate
Trend Analysis Collect data over a longer period of time to discover trends and changes in behavior, preferences or opinions.
function
Monitoring Progress. Measure how participants are progressing through regular measurements, such as pulse surveys or quarterly reports.
function
Track personal growth Give participants insight into their own progress by feeding back results through personalized dashboards or reports.

Low thresholds, high participation

calculate
Anonymous or personal Increase willingness to participate by ensuring anonymity. Alternatively, make it personal and tailored to the participant.
function
With or without an account Keep the threshold low for quick participation without extra steps.
function
Access through different channels Distribute a personalized or anonymous link via email or place QR code on your intranet. Enter via web browser or on mobile.
function
Smart reminders Use automated e mails or notifications to subtly remind participants without being intrusive.

Measurements and algortimes

calculate
Scoring and calculations Create your own algorithms to calculate scores or statistics directly from responses, such as for risk analysis or satisfaction indices.
function
Recode Recode restructures data, corrects errors, and makes analysis easier and more accurate.
function
Measurements Convert the acquired data into measurable values by setting cut-off points. This allows you to draw clear conclusions and gain actionable insights.

Analyze and optimize with powerful analytics

calculate
All kinds of graphs Charts such as bar , pie and line charts for insightful analysis.
function
Filtering and breakdowns. Segmentation based on demographics, time period or specific responses.
function
Benchmarking Compare results to industry averages, previous measurements or external datasets.
function
Write your own report texts Write your own texts so that analyses and conclusions connect directly to your target audience.

Supervise participants with coaches or professionals

calculate
Coach on results Set goals and track progress based on survey results.
function
Provides guidance and tools Instant access to resources and interventions based on results.
function
Engage in the conversation Ask targeted questions and offer personalized feedback based on the survey results.
function
Make it personal Tailor the coaching and guidance to the participant's input.

A participant portal that inspires action

calculate
Insight into results Instant, automated feedback on completed responses.
function
Turn results into action Use the insights from the results to take targeted steps, achieve goals and make improvements.
function
Personalization Customize the experience based on the participant so that questions, feedback and reports are relevant and tailored.