ANALYTICS DASHBOARD
Real-time data access & management
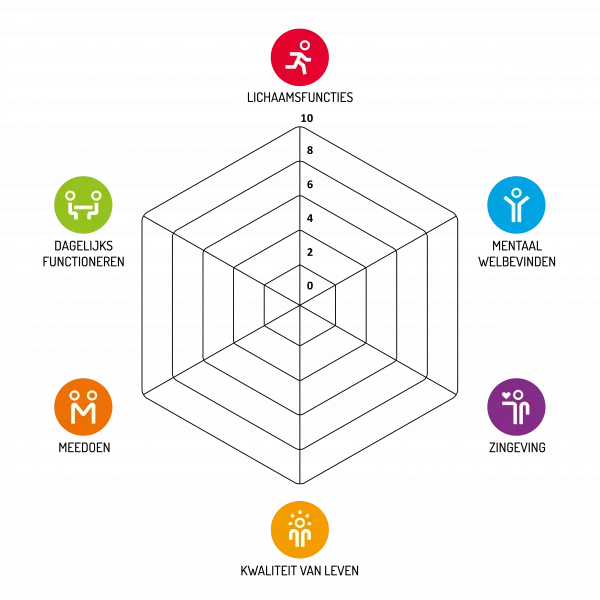
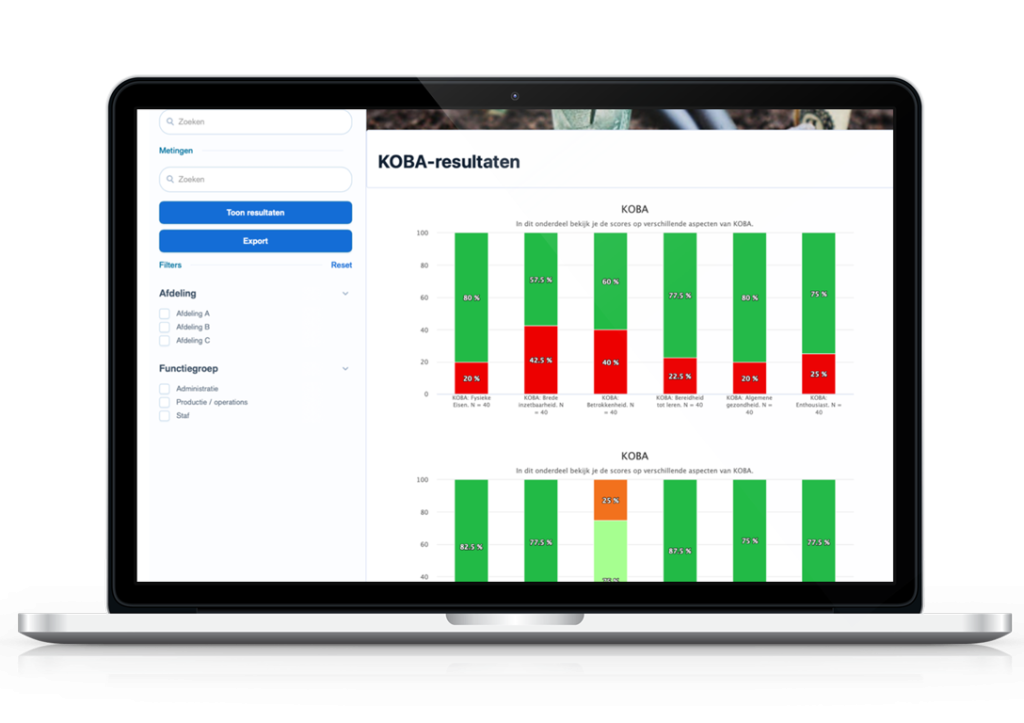
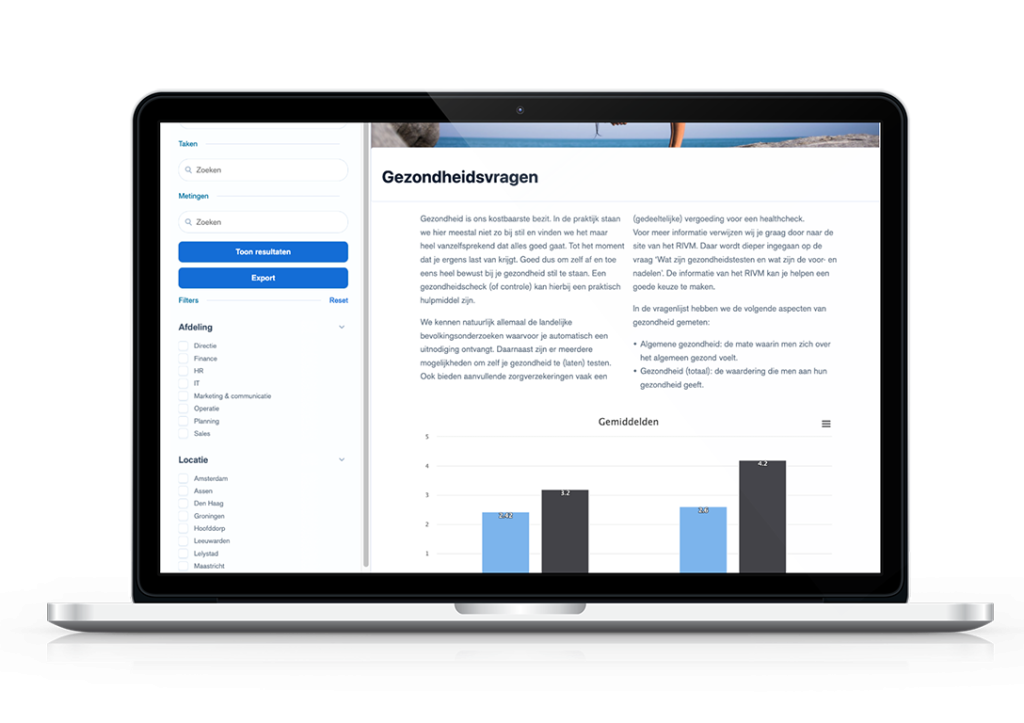
Positive Health is easy to deploy to specific groups and the entire process can be managed with smart software.User scores are specified by item and can be easily filtered by department, region, position, age, district or years of service.
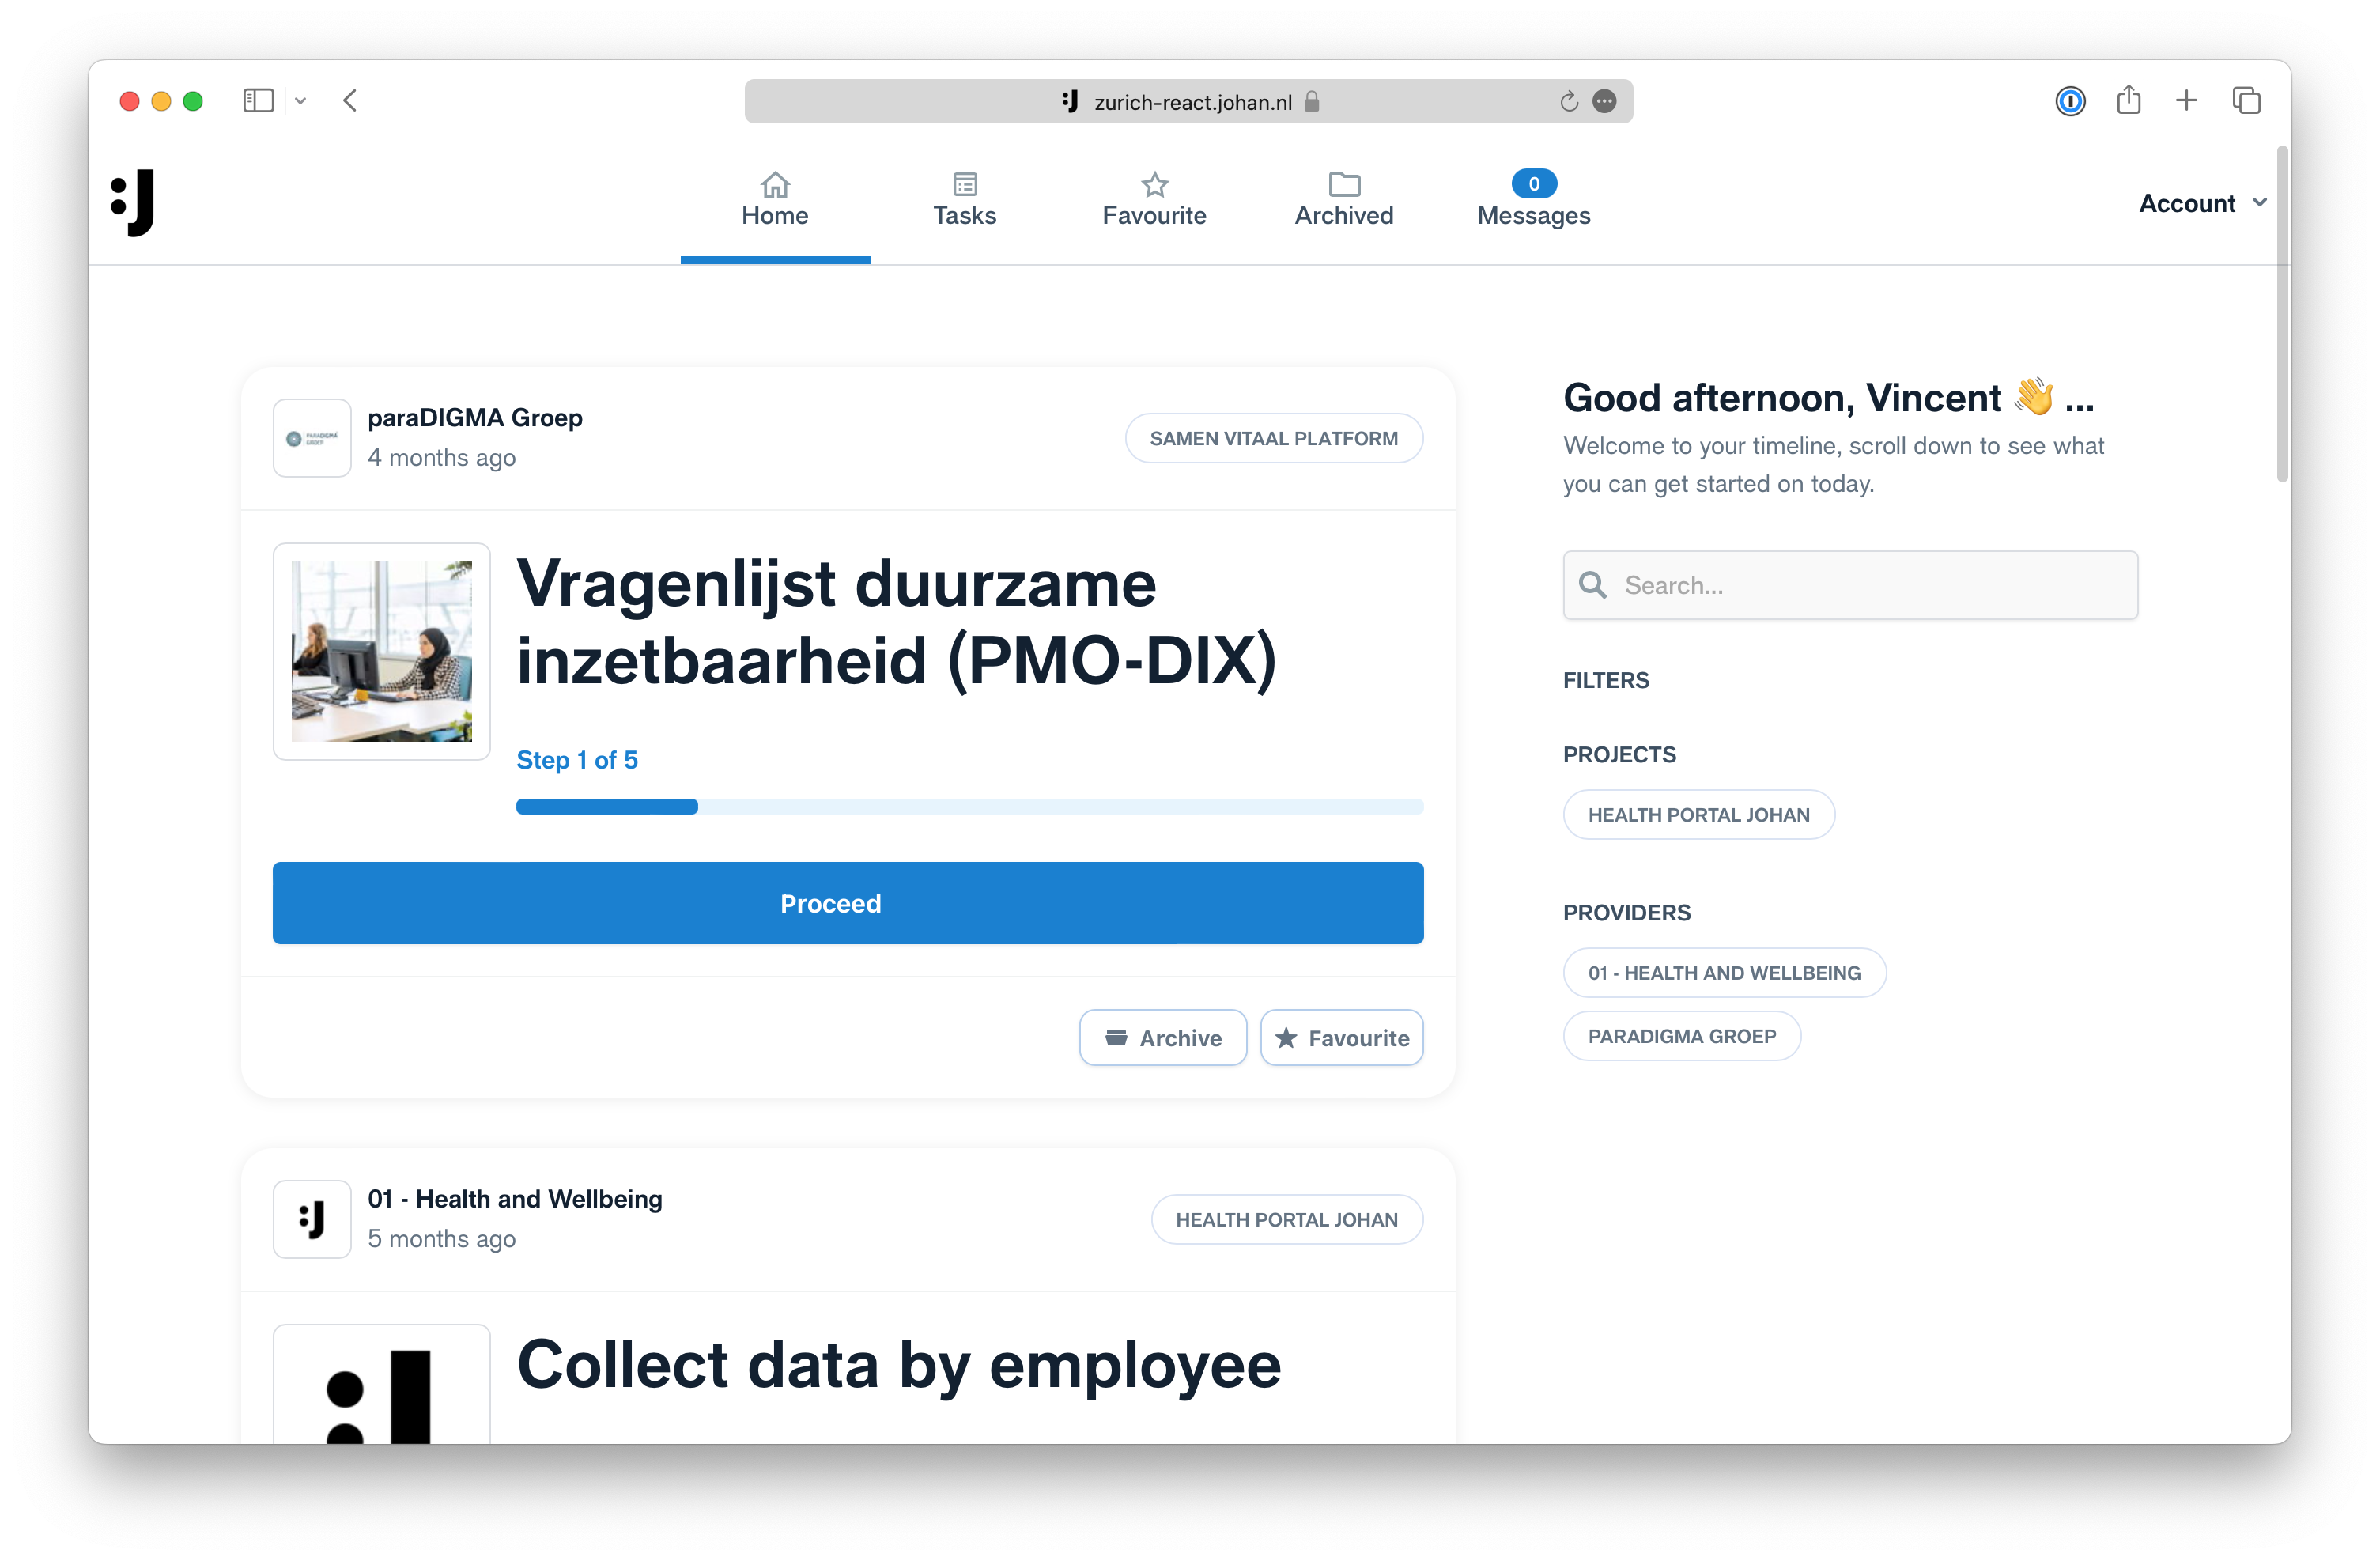
This can all be found in the comprehensive analytics dashboard. Here you can log in and participants' results are visible at the group level.
Cross links and more...
In addition to filtering in the analytics dashboard, it is possible to easily make advanced cross-references. This allows you to analyze which factors affect each other the most so you can take effective actions.
Do people who score lower on Daily Functioning also suffer more from their Body Functions? And how does this affect quality of life?